
WORKLOAD AUTOMATION
Workload Automation Software Solutions
Optimize critical business processes and increase operational efficiency with centralized, enterprise-wide workload management
Explore our portfolio of workload automation solutions that orchestrate workflows across on-premise and cloud-based applications and systems.


Tidal by Redwood
Gartner® 2025 Magic Quadrant™ for SOAP
Gartner has named Redwood a Leader, positioned furthest in Completeness of Vision and highest for Ability to Execute, in its Magic Quadrant™ for Service Orchestration and Automation Platforms (SOAPs).
Download now
Platform Overview
The Unified Enterprise Workload Automation Platform
Tidal is built for enterprise organizations with complex IT automation needs. With robust dependency management capabilities, thorough scalability, high availability, and a user-friendly interface to boot, the choice couldn’t be more clear.
Seamlessly connect your enterprise applications and systems to Tidal Automation with our 40+ pre-built integrations. Integrate across your entire environment, from on-premise data centers to cloud environments and hybrid environments.
Tidal’s job scheduling software provides scalable business process automation for a wide range of job types, including batch jobs, scripts, database operations, IT processes, managed file transfers, and more.
Here’s what you can do with Tidal’s scheduling tool that you can’t do with other workload automation tools:
- Increase efficiency with advanced job scheduling and workload automation and ensure all jobs are executed at the right time, in the correct order, and with the necessary dependencies.
- Orchestrate end-to-end business processes across multiple systems and applications. Advanced workflow orchestration capabilities enable IT teams to manage complex workflows and streamline the IT environment.
- Automate responses to real-time events with event-based automation across multi-cloud and hybrid cloud environments.
- Harness self-service capabilities so authorized users can perform job template creation, job scheduling, and more without direct involvement from IT teams.
- Optimize allocation and optimization of IT resources to maximize infrastructure-wide efficiency across servers, databases, networks, and storate systems. Easily work in conjunction with IT infrastructure provisioning tools to allocate resources like servers or virtual machines.
- Manage and define dependencies between different jobs and tasks to ensure smooth workflow execution and reduce errors.
- Proactively monitor and resolve issues with real-time notifications that alert stakeholders at various stages of job execution or in the event of failures so teams can always meet service level agreements (SLAs).
- Gain deep insights into analytics by monitoring and analyzing job exection, resource utilization, and performance metrics
- Integrate with your business applications, platforms, and technologies to ensure business needs are met. APIs and connectors provide seamless integration and extensibility.

Digital Transformation, Enabled and Enhanced
A key part of successful digital transformation is automated IT operations. As environments get more complex, it’s more important to centralize job scheduling for batch processes across your entire enterprise.
That automation doesn’t stop at IT; DevOps teams love how well Tidal integrates with the CI/CD pipeline, automates release management, and provides audit trails that help maintain compliance accountability.
Tidal helps with a wide variety of use cases, including batch processing, mainframe job scheduling, data integration, big data processing tasks, retrieving data from web services, ETL, job scheduling for ERP systems, and more.
Resource
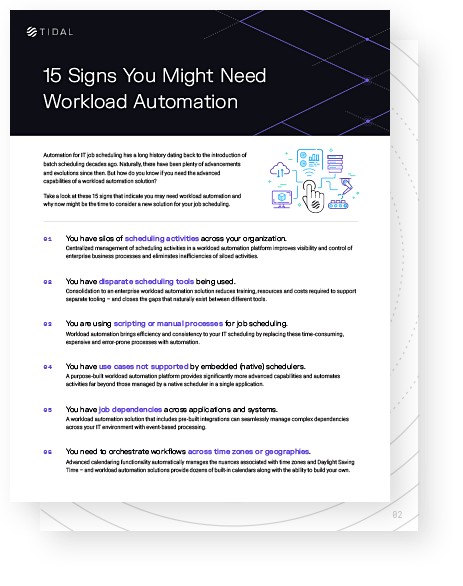
15 Signs You Might Need WLA
How do you know if you need the advanced capabilities of a workload automation solution? These 15 signs indicate when it may be time to consider a new solution for job scheduling.
See The SignsResources
Learn More About Our Solutions
Frequently Asked Questions
-
How does workload automation software handle dependencies and task sequencing?
Workload automation software allows users to define dependencies between jobs, prioritize jobs based on requirements, enable parallel execution of independent tasks, and utilize event-based triggers for job execution. These capabilities ensure jobs are executed in the right order and account for dependencies and data availability. Workload automation software minimizes error caused by premature or out-of-order execution, improves workflow efficiency, and optimizes resource utilization.
Learn how Tidal Explorer optimizes workload automation activities.
-
What business applications does Tidal’s workload automation software integrate with?
Tidal has 40+ pre-built integrations with popular tools and operating systems, including IBM, Apache Hadoop, SAP, Oracle, Microsoft Windows, Informatica, and more. Tidal is designed to deliver automation across all layers of the enterprise for both legacy and modern solutions. We also offer a full set of tools to build integrations with your own applications and other systems.
-
What are alternative workload automation software providers?
Other SaaS workload automation solutions include:
Tidal offers a more comprehensive job scheduling, dependency management, and workflow orchestration feature set than JAMS or Stonebranch. With a broad range of cross-platform support and integrations and a low-code, user-friendly interface, Tidal is built to handle complex, technical enterprise automation.